0. R Cheatsheets
http://www.rstudio.com/resources/cheatsheets/


1. Choosing Visualization Tools
Rule #1: No tool will turn you into a pro.
Rule #2: First learn one single tool very well.
Rule #3: Choose tools you are totally in love with.
Ggplot2
The main website by the author, Hadley Wickham: http://ggplot2.org/
* Ggplot2 package will give you the most return on the time you invest learning how to use it
* A quick reference (cheatsheet) for ggplot2 “Data Visualization”
* A short intro/tutorial for ggplot2
Ggvis
The main website: http://ggvis.rstudio.com/
* Ggvis is used “…more for data exploration than data presentation. …ggvis makes many more assumptions about what you’re trying to do: this allows it to be much more concise, at some cost of generality.”
* “Ggvis provides a tree like structure allowing properties and data to be specified once and inherited by children.”
* Ggvis vs Ggplot2
* Range selector for ggvis
2. Choosing Tools for Interactivity
Shiny
The main website: http://shiny.rstudio.com/gallery/
Shiny simply turns your R into a web server and lets you interact with your data through a browser. See the cheatsheet “Shiny” (also above).
Shiny is ok to start with, however you might wish to extend it with widgets or whatever fits your needs best.
Htmlwidgets
The main website: http://www.htmlwidgets.org/develop_intro.html
pros:
https://rstudio.github.io/dygraphs/gallery-range-selector.html
https://christophergandrud.github.io/networkD3/
http://www.htmlwidgets.org/showcase_threejs.html
https://github.com/htmlwidgets/sparkline
cons: large datasets might need to be uploaded to the client for some widgets
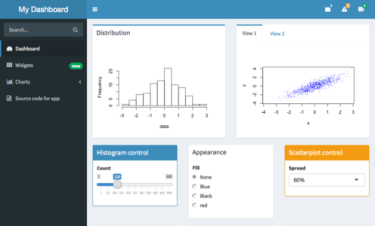
3. Building a Dashboard
Dashboard Theory
Stephen Few
Stephen’s Website
His book “Information Dashboard Design” on Amazon
Why Most Dashboards Fail (pdf)
Dashboards are Dumb (or how we sometimes delude ourselves with fancy dashboards)
The essence in one quote: “The key to usability is the association between appropriate controllers and the individual meters. In a car, the controllers are the steering wheel, the gas pedal, the brake pedal, the ignition switch, and the gearshift, primarily. Generally, there are one or two controllers associated with each meter and the action of each controller is usually proportional to the metric that appears on the meter (e.g. Gas pedal and brake pedal control speed; gas pedal and gear shift control RPM, etc.). There are more controllers on a plane, but the same relationships hold between controllers and meters, at least for older planes.”
Risk Communication Dashboards (pdf)
Nine User Interface Design Patterns
Ten Tips to Design User-Friendly Dashboards
Shiny and GoogleVis
http://www.r-bloggers.com/dashboards-in-r-with-shiny-and-googlevis/

Shinydashboard
http://glimmer.rstudio.com/reinholdsson/shiny-dashboard/
Examples
Security Dashboards in Shiny
Dashboard design Using MS Excel *
* In case you have to use Excel, have a look at “Sparklines for Excel” maintained by Fabrice Rimlinger: http://sparklines-excel.blogspot.com/
4. Managing Your Workflow
A workflow is used to automate repetitive operations you perform on the data. In case you generate so much data it turns into a hard-to-use pile, as was in my case, you can plan ahead and have a look at various tools that suit your needs. I am still a long way from organizing every aspect of the project into a coherent system, but my preliminary survey of available software makes me think that DAWN (see below) seems to be most flexible; however, it requires most programming skills. Other tools, such as Rapid Miner or Weka, can be used with the R programming environment almost out of the box.
Rapid Miner (open source)
https://rapidminer.com/ (R is integrated via a standard plugin downloadable from within the software itself)

Dawn Science (open source)
Data Analysis WorkbeNch (DAWN) is an eclipse based workbench for doing scientific data analysis. It implements sophisticated support for the following:
(1) Visualization of data in 1D, 2D and 3D
(2) Python script development, debugging and execution
(3) Processing and Workflows for visual algorithms analyzing scientific data
http://www.dawnsci.org/ (use the source code & eclipse as the base)

Weka (open source)
http://www.cs.waikato.ac.nz/ml/weka/

How to integrate R into Weka: http://markahall.blogspot.ru/2012/07/r-integration-in-weka.html
Magittr (R package)
http://cran.r-project.org/web/packages/magrittr/index.html (included in dplyr package dependency)
This R package brings “forward-piping” operators, e.g. %>% (Just see the ‘cheatsheet’ “Data Wrangling” above.)
quote from the description of the package: “The magrittr package offers a set of operators which promote semantics that will improve your code by structuring sequences of data operations left-to-right (as opposed to from the inside and out), avoiding nested function calls, minimizing the need for local variables and function definitions, and making it easy to add steps anywhere in the sequence of operations.”
Other Datamining Software (commercial and open source)
http://decisiontrees.net/decision-trees-and-data-mining-software/
5. Data Mining/Analytics Workflow Theory


6. Useful Quotes from R-Bloggers, Mostly
An Introduction to Statistical Learning with Applications in R (free pdf)
http://www-bcf.usc.edu/~gareth/ISL/
 “This book provides an introduction to statistical learning methods. It is aimed for upper level undergraduate students, masters students and Ph.D. students in the non-mathematical sciences. The book also contains a number of R labs with detailed explanations on how to implement the various methods in real life settings, and should be a valuable resource for a practicing data scientist.”
Elements of Statistical Learning (free pdf)
http://statweb.stanford.edu/~tibs/ElemStatLearn/download.html
 “The go-to bible for this data scientist and many others is The Elements of Statistical Learning: Data Mining, Inference, and Prediction by Trevor Hastie, Robert Tibshirani, and Jerome Friedman. Each of the authors is an expert in machine learning / prediction, and in some cases invented the techniques we turn to today to make sense of big data: ensemble learning methods, penalized regression, additive models and nonparemetric smoothing, and much much more.”
Machine learning
In-depth introduction to machine learning — 15 hours of expert videos
Free Ebooks on Machine Learning
Why you should learn R first for data science
http://www.r-bloggers.com/why-you-should-learn-r-first-for-data-science/ (selected quotes below):
Data wrangling
“It’s often said that 80% of the work in data science is data manipulation. … R has some of the best data management tools you’ll find. The dplyr package in R makes data manipulation easy. … When you “chain” the basic dplyr together, you can dramatically simplify your data manipulation workflow.”
Data visualization
“ggplot2 is one of the best data visualization tools around, as of 2015. What’s great about ggplot2 is that as you learn the syntax, you also learn how to think about data visualization. … there is a deep structure to all statistical visualizations. There is a highly structured framework for thinking about and creating all data visualizations. ggplot2 is based on that framework. By learning ggplot2, you will learn how to think about visualizing data.
Moreover, when you combine ggplot2 and dplyr together (using the chaining methodology), finding insight in your data becomes almost effortless.”
Machine learning
“While … most beginning data science students should wait to learn machine learning (it is much more important to learn data exploration first), machine learning is an important skill. When data exploration stops yielding insight, you need stronger tools … [and] R has some of the best tools and resources.
One of the best, most referenced introductory texts on machine learning, An Introduction to Statistical Learning, teaches machine learning using the R programming language. Additionally, the Stanford Statistical Learning course uses this textbook, and teaches machine learning in R.”
Data Sources
Quandl — free & premium financial market data (think “free Bloomberg in the format you want”)
Over 70 free large data repositories (updated) — a broad range of data (including finance related)
FDF Financial Data Finder
Datasets for Data Mining and Data Science at KDnuggets
Quant Finance Resources at CalTech
Ideas, Bells, and Whistles
Working with Time Series
Graphing Highly Skewed Data
In 4 Steps your Application (including R) is running on a Cloud Computing Cluster
Eight New Ideas From Data Visualization Experts
Hierarchical Clustering with R (featuring D3.js and Shiny)
A Growing List of 20+ Free Ebooks on Datamining
Big Data Made Simple: Feed on Visualization
My collection of visualization and datamining software and libraries
7. Where to Ask for Help
General R questions
#R channel at Freenode (IRC network) — perhaps, the fastest way to get help with R
StackOverflow
Shiny
Shiny at rstudio.com
Shiny Google Group

Recent Comments